Data Visualisation
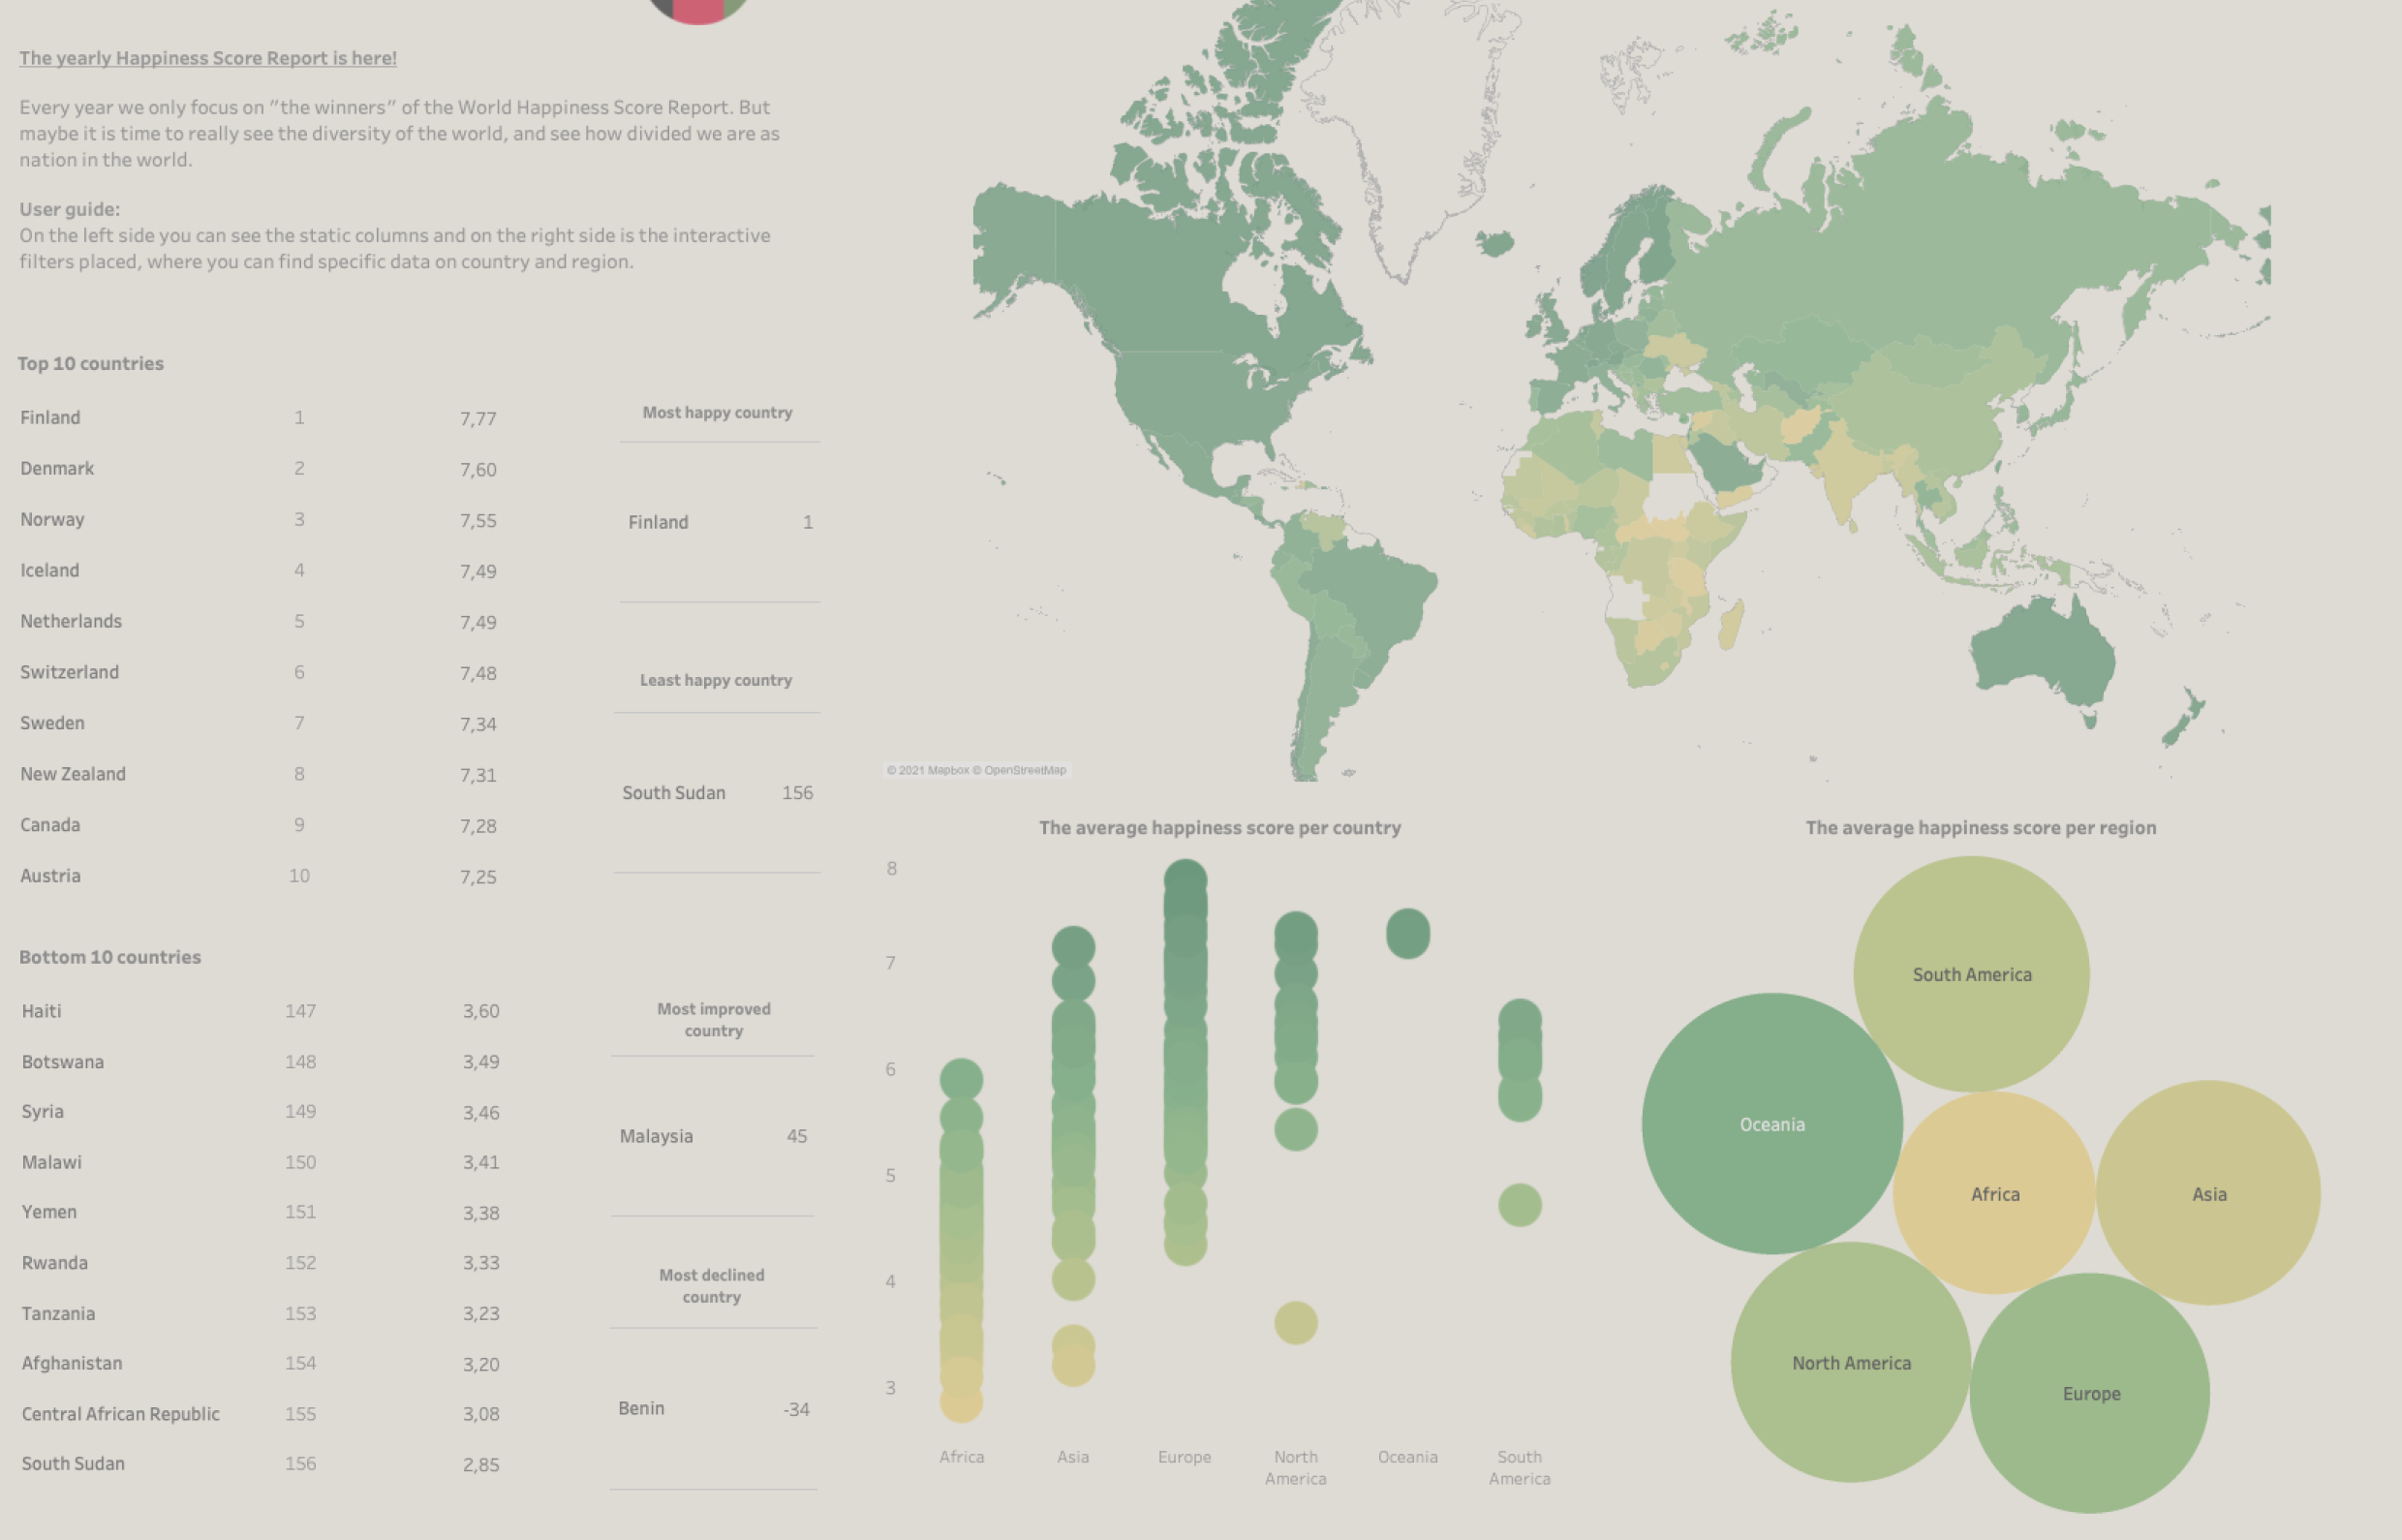
Happiness or Diversity?
This project is a data visualization in Tableau and is part of an exam assignment in the course, Data Design. The dataset contains a score for each country in the world, which defines on the basis of some parameters whether a country is happy.